In any complex system, the most dangerous data points are the ones that never arrive. We have a natural tendency to focus on the “winners”—the survivors of a process—while ignoring the failures that were filtered out before they could be measured.
This oversight is known as Survivorship Bias.
The most famous case study in this field comes from World War II. The U.S. military was looking to minimize aircraft losses from enemy fire. Engineers at the Center for Naval Analyses examined returning planes, meticulously mapping the locations of bullet holes. They found a high concentration of damage on the wings, the tail, and the fuselage.
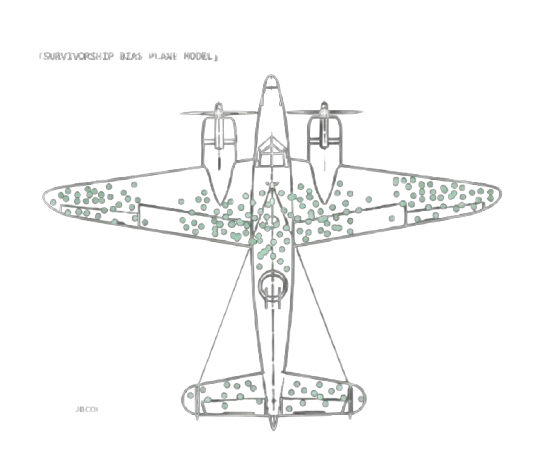
The “logical” conclusion was to add heavy armor to these specific sections.
The Wald Correction
Abraham Wald, a statistician at the Statistical Research Group (SRG), reached the opposite conclusion. He realized that the military was looking at a filtered dataset: they were only analyzing the planes that had successfully returned to the base.[1]
Wald’s insight was simple but transformative: the holes in the returning planes represented areas where a plane could take a hit and still fly. The lack of holes in the engine and cockpit wasn’t because those areas weren’t being hit; it was because a single hit to those critical components resulted in a total system failure.
The planes hit in the “clean” areas were the ones at the bottom of the ocean. Wald recommended armoring the places where the surviving planes weren’t hit.[2]
The Math of Conditioned Data
To understand Survivorship Bias, we have to look at Conditional Probability. If we let represent the event that a plane survives and represent the event that a plane is hit in a specific location, we are often interested in the probability of survival given a hit:
The engineers initially assumed that because they saw many hits on the wings (), the probability of failure given a hit there must be high. In reality, they were seeing:
They were observing the distribution of hits given that the plane had already survived. This is a fundamentally different metric. In a high-fidelity audit, the “missing” data (the planes where ) contains the most critical information for system reinforcement.
The Engineering Trap
For the developer or the maker, survivorship bias is a constant risk. We study successful startups to find a “blueprint,” or we read post-mortems of projects that survived a crisis. But if we don’t account for the thousands of projects that failed under the same conditions, we are optimizing for a filtered reality.
In software performance, this often manifests as looking at average response times while ignoring the “timeout” errors. If a system is so slow that the connection drops, that data point is removed from your averages. Your metrics might show a “fast” system, when in reality, you’ve simply filtered out the slowest users.
System Takeaway
Fidelity requires looking at the gaps. Whether we are reinforcing a physical chassis or optimizing a backend worker, we must ask: what data am I not seeing?
Dullness is often a sign of strength, and a lack of noise in a specific area might actually be a signal of a catastrophic vulnerability. To build a resilient system, you have to account for the planes that didn’t make it back to the grid.
References
Mangel, M., & Samaniego, F. J. (1984). Abraham Wald’s Work on Aircraft Survivability. Journal of the American Statistical Association. The definitive review of Wald’s classified WWII memos. ↩︎
Wald, A. (1943). A Method of Estimating Plane Vulnerability Based on Damage of Survivors. Statistical Research Group, Columbia University. (Declassified in 1980). ↩︎