There is a moment in the history of sports that every analytics story eventually points back to. In 2002, the Oakland Athletics, a team with one of the smallest payrolls in baseball, won 103 games and pushed the sport’s giants to the brink of the playoffs. They did it by ignoring what scouts saw with their eyes and trusting what the numbers said instead.1
The story became a book, then a movie, and the phrase Moneyball entered the language as shorthand for the moment quantification stopped being a hobby and became the way sports are run.
More than two decades later, every major American sport has had its own Moneyball moment, and then some. MLB has Statcast and expected batting statistics. The NBA has a three-point revolution built on shot math. The NFL has expected points and player tracking on every play. The NHL has expected goals and sensors inside the puck. None of this happened by accident. It happened because quantification solves real problems that the eyeball test cannot, and every league that embraced it gained an edge that the others were forced to match.
The argument for quantification in sports comes down to four claims, and they hold across all four leagues. The methods differ, but the underlying logic is the same. And the payoff, from finding undervalued players to changing how the game itself is played, has been enormous.
The case for counting
The first argument for quantification is that the human eye is a bad measuring instrument. The eyeball test is not worthless, but it is systematically biased. People remember the memorable moments, the walk-off home run and the game-winning touchdown, and forget the hundreds of ordinary plays that actually decide seasons. A scout watching a player over a few games is forming a narrative, not taking a measurement. Quantification replaces the anecdote with the sample. It lets a team evaluate a player over thousands of plate appearances or hundreds of possessions instead of a handful of glimpses.
The second argument is that quantification finds value the market misses. This was the core insight of Moneyball. The Athletics did not have the budget to compete for star players, so they looked for skills that were genuinely valuable but systematically underpriced. In the early 2000s, that skill was getting on base. The market paid for batting average and home runs while underpaying on-base percentage, even though on-base percentage was worth more in terms of actual runs scored.2 A team that can measure value better than its competitors can buy it cheaper. That is not a baseball insight. It is an economics insight, and it applies to every league.
The third argument is that quantification separates skill from luck. Sports are noisy. A hitter can go through a month where every ball finds a glove, a quarterback can throw five interceptions on tipped passes, a goalie can allow goals on shots that go in once in a hundred tries. Raw results in small samples are mostly luck. The modern answer is the expected model, a statistical estimate of what should have happened given the quality of the underlying actions. Expected stats strip out the randomness and leave the signal of actual skill behind. This is the single most important idea in modern sports analytics, and every league has its own version.
The fourth argument is that quantification turns judgment into a process. A general manager who relies on gut instinct cannot be audited, cannot be taught, and cannot improve. A general manager who relies on a model can see exactly why a decision was made, test whether similar decisions worked in the past, and get better with every season of data. The numbers do not replace the human decision. They discipline it.
How the counting is done
The mechanics of quantification follow a similar arc in every sport. It starts with event data, the raw record of what happened. The box score is the first layer. The play-by-play log is the second. And the newest layer is tracking data, cameras and sensors that record the position of every player and, in some sports, the ball or puck itself, dozens of times per second.
The next step is assigning value. A home run is not worth the same as a single, a three-pointer is not worth the same as a two, a touchdown pass is not worth the same as a three-yard gain on first down. Analysts build linear weights, values for each outcome derived from how much it actually contributes to scoring. Baseball has weights for every outcome of a plate appearance.3 Basketball has points per possession. Football and hockey have expected points and expected goals, models that assign every play and every shot a value based on the situation.
The step after that is context. Raw numbers lie about context. A hitter who plays half his games in a hitter’s ballpark looks better than he is. A quarterback who throws in the fourth quarter while trailing by 30 faces a different defense than one protecting a lead. A defenseman who plays against the opponent’s best line has a harder job than one who does not. Adjustment is the discipline of removing these distortions, so that the number left over measures the player rather than his circumstances.
The final step is the expected model, which is where the modern era begins. Instead of asking what happened, ask what should have happened. A batter’s expected wOBA takes the quality of his contact and asks what a league-average outcome for that contact would be. A shot’s expected goal value takes its location, angle, and type and asks how often such shots go in. A football play’s expected points takes the down, distance, and field position and asks how many points the team should score from there. The gap between what should have happened and what did is the skill signal, and the luck.
Baseball
Baseball was the first sport to quantify itself seriously, because it was the first sport with discrete events and a century of box scores. The modern stack runs from wOBA, which weights every outcome of a plate appearance by its run value, to wRC+, which adjusts for ballpark and league context, to the expected statistics built on Statcast.4
Statcast, installed in every MLB stadium since 2015, is the crown jewel of baseball measurement.5 Radar and optical tracking record the speed, spin, and movement of every pitch, and the exit velocity and launch angle of every batted ball. For the first time, the game could measure not just what happened but why. Hitters learned that a batted ball leaving the bat at 110 mph with a launch angle of 25 degrees is a home run almost regardless of where it is hit, and the launch angle revolution was born. Pitchers learned that a fastball’s perceived velocity and movement matter more than the radar gun reading, and the era of swing-and-miss stuff began.
The payoff is visible in how players are now evaluated. A pitcher is no longer judged by ERA, which is heavily influenced by defense and luck, but by how hard his stuff is to hit. A hitter is no longer judged by batting average, which is heavily influenced by where balls happen to land, but by the quality of contact he produces. And the newest metrics even separate the value a hitter creates against elite pitching from the value he creates against mistakes, a distinction that was invisible for a century.6
Basketball
Basketball had a different problem. The sport was easy to count, every shot and rebound and assist, but the counting was misleading. Field goal percentage treated a three-pointer and a midrange jumper as the same shot, even though the three is worth 50% more. A player who shoots 40% from three is scoring as efficiently as a player who shoots 60% from two, and the sport’s traditional stats could not see it.
The fix was a simple piece of arithmetic with revolutionary consequences. Effective field goal percentage weights a three-pointer as one and a half field goals, and true shooting percentage extends the same logic to free throws.7 Once teams could see scoring efficiency clearly, the math pointed in one direction: the three-pointer is the best shot in basketball, and the midrange jumper is the worst one available. The league responded the way markets respond to information, with a flood of threes.
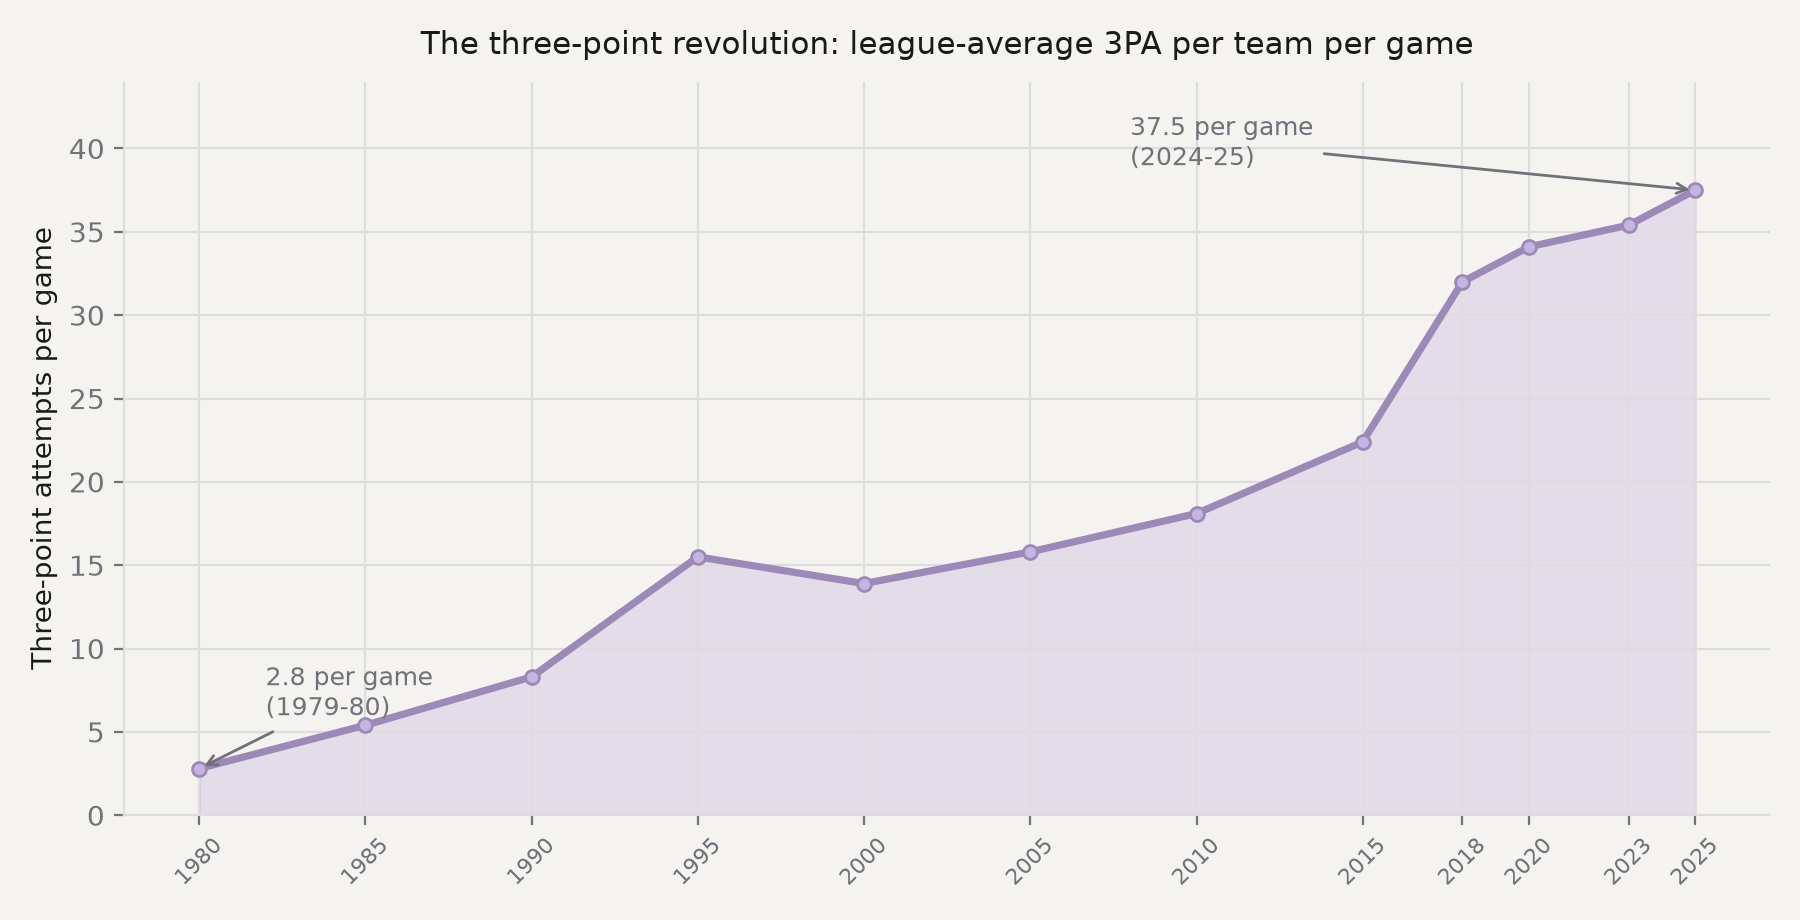
The numbers are staggering. In the 1979-80 season, the first with the three-point line, NBA teams averaged 2.8 three-point attempts per game. By 2018-19, that number had grown to 32 per game, and it has kept climbing since, past 37 per game in 2024-25.8 The chart above tells the story of an entire offensive philosophy being rebuilt around a single measured fact.
The tracking layer arrived with SportVU cameras and then Second Spectrum, which record the position of every player and the ball 25 times per second.9 That data made it possible to measure what happened away from the ball: how much space a shooter creates, how well a defender contests, how much a player’s presence helps his teammates. Combined with plus-minus style metrics that measure how a team performs with a player on the floor, the modern NBA evaluation stack can estimate a player’s total impact in ways the box score never could.
Football
Football was the hardest sport to quantify, because its raw stats are the least connected to winning. A 300-yard passing game can be a loss. A 3-yard run can be the most important play of the game. Yards and touchdowns do not account for the most important variable in football, which is situation. A 5-yard gain on third and 2 is a success. The same 5-yard gain on first and 10 is almost meaningless.
The fix is the expected points model. Every spot on the field in every game state carries an expected point value, the average number of points a team in that situation can expect to score before the drive ends. A play’s value is the difference between the expected points before the play and after it, called expected points added, or EPA.10 EPA does for football what linear weights did for baseball: it prices every play by its actual contribution to scoring, in points, with full accounting for down, distance, and field position.
The companion metric is DVOA, defense-adjusted value over average, which compares every play to a league-average baseline and then adjusts for the quality of the opponent.11 A team that gains 100 yards against a great defense is doing something harder than a team that gains 100 yards against a terrible one, and DVOA makes that explicit.
The result of all this measurement was a quiet revolution in coaching. The data showed that teams were far too conservative on fourth down, punting and kicking field goals when going for it would score more points on average. The analytics-friendly coaches who trusted the numbers started going for it, the league followed, and the fourth-down decision became the most visible battle between the eyeball test and the spreadsheet in modern football. The NFL’s Next Gen Stats takes this further, using RFID tags in shoulder pads to track the speed and location of every player on every play, adding a layer of physical measurement that did not exist a decade ago.12
Hockey
Hockey has the opposite problem from basketball. Scoring is so rare that raw goals are a terrible sample. A good player can go ten games without a goal, and a bad one can score twice in a night. Even plus-minus, the traditional all-in-one stat, is polluted by linemates, goaltending, and usage. For decades, hockey was the least measured of the major sports.
The first breakthrough was Corsi, a count of shot attempts for and against while a player is on the ice. It sounds crude, but it works. Shot attempts are far more common than goals, so they form a much larger and more reliable sample, and they turn out to predict future success better than goals do. A team that dominates shot attempts tends to dominate games, even when the goals are not following.13
The second breakthrough was expected goals, or xG. Instead of counting all shots equally, xG assigns each shot a probability of scoring based on its location, angle, and type. A shot from the slot is worth many times a shot from the blue line, and the model knows the difference. Summed over a season, xG separates the skill of creating and preventing scoring chances from the randomness of whether the chances go in. It is the hockey version of expected wOBA, and it has become the lingua franca of hockey analysis.14
The newest layer is the league’s puck and player tracking system, which has been live in every arena since the 2021-22 season. Infrared cameras track sensors in the pucks and in the players’ jerseys, generating the kind of microstatistical detail that baseball and basketball have had for years: pass completion rates, shot speed, skating distance, and the geometry of every scoring chance.15 Hockey is finally joining the measurement era, a decade and a half after the other leagues.
The same game
| League | Signature metric | What it prices | What it changed |
|---|---|---|---|
| MLB | wOBA, xwOBA, Statcast | Every outcome’s run value, quality of contact | Launch angle era, stuff-based pitching evaluation |
| NBA | eFG%, TS%, plus-minus | Scoring efficiency per possession | The three-point revolution, positionless basketball |
| NFL | EPA, DVOA | Points added per play, adjusted for situation | Fourth-down aggressiveness, pass-heavy offenses |
| NHL | Corsi, xG | Shot quality and shot volume | Possession-based evaluation, xG-era coaching |
The table above is the whole argument in miniature. Four sports, four different histories, four different data sources, and one identical pattern. Count the events, assign value, adjust for context, and build expectations to separate skill from luck. Every league that followed the pattern found the same two things: players the market was mispricing, and strategies the game was leaving on the table.
Limitations
Quantification has limits, and the honest case for it includes them. The numbers cannot measure everything that matters. Effort, leadership, chemistry, and the ability to rise in big moments are real, and they resist measurement. The best organizations do not choose between the eyeball test and the spreadsheet. They use both, with each disciplining the other.
There is also the risk that Goodhart warned about: when a measure becomes a target, it ceases to be a good measure.16 The launch angle revolution produced not just more home runs but also more strikeouts and more three true outcomes. The three-point revolution produced offenses so dependent on the deep ball that some broadcasts feel like a shooting contest. These are the costs of optimizing for what is measured, and they are real. The answer is not to stop measuring. It is to keep building better measures.
Takeaways
The case for quantification in sports is not that numbers are smarter than people. It is that numbers are honest in ways people are not. They do not remember only the highlights. They do not get dazzled by a player’s body type or a team’s narrative. They do not flinch in the fourth quarter of a big game. Measured correctly, they tell the truth about who contributes and who does not, which strategies work and which are tradition.
Footnotes
-
Lewis, M. (2003). Moneyball: The Art of Winning an Unfair Game. W. W. Norton & Company. The definitive account of the Oakland Athletics and Billy Beane. ↩
-
Baumer, B., & Zimbalist, A. (2014). The Sabermetric Revolution: Assessing the Growth of Analytics in Baseball. University of Pennsylvania Press. On how on-base percentage was systematically undervalued in the early 2000s market. ↩
-
FanGraphs. Linear Weights. Sabermetrics Library. https://library.fangraphs.com/principles/linear-weights/ ↩
-
FanGraphs. wOBA. Sabermetrics Library. https://library.fangraphs.com/offense/woba/ ↩
-
MLB.com. Statcast. Glossary. https://www.mlb.com/glossary/statcast ↩
-
Goldstein, J. (2026). Pitch-Quality Surplus (PQS): Measuring Hitter Value Net of Pitch Quality. Preprint, August 14, 2026. ↩
-
NBAstuffer. What Is True Shooting Percentage? https://www.nbastuffer.com/analytics101/true-shooting-percentage/ ↩
-
Wikipedia. Three-point revolution. https://en.wikipedia.org/wiki/Three-point_revolution ↩
-
Wikipedia. Player tracking (NBA). https://en.wikipedia.org/wiki/Player_tracking_(NBA) ↩
-
ESPN. NFL: Explaining Expected Points and EPA. https://www.espn.com/nfl/story/_/id/8379024/nfl-explaining-expected-points-metric ↩
-
FTN Fantasy. What Is DVOA? Football Stat Explainer. https://ftnfantasy.com/nfl/dvoa-explainer ↩
-
NFL Next Gen Stats. https://nextgenstats.nfl.com/ ↩
-
Evolving-Hockey. General Terms: Corsi. https://evolving-hockey.com/glossary/general-terms/ ↩
-
Evolving-Hockey. General Terms: Expected Goals. https://evolving-hockey.com/glossary/general-terms/ ↩
-
NHL.com. NHL EDGE website provides Puck and Player Tracking data. https://www.nhl.com/news/topic/nhl-edge/nhl-edge-launches-website-for-puck-and-player-tracking-data ↩
-
Goodhart, C. A. E. (1975). Problems of Monetary Management: The U.K. Experience. Papers in Political Economy. ↩