In 2026, baseball changed in a way that most fans barely noticed until it was already happening. Major League Baseball adopted the Automated Ball-Strike challenge system, or ABS, which lets a team challenge a ball or strike call and have it checked against the automated strike zone. Each team gets two challenges per game, and here is the crucial rule: a successful challenge is kept, a failed one is spent.[1]
That one rule turns a simple judgment call into a strategic resource. Two challenges is a tiny budget for a nine-inning game, and every time a catcher taps his head or a batter steps out to signal the dugout, the team is gambling a piece of that budget on a single pitch.
The problem is that nobody had a good way to measure whether that gamble was worth it. Teams tracked challenge success rates, the share of challenges that get overturned, and treated it like accuracy on a test. But a catcher who wins 60% of his challenges on 0-0 counts in the first inning and a catcher who wins 60% of his challenges on full counts with the bases loaded in the ninth have identical success rates and wildly different value. Success rate measures whether a player is right. It says nothing about whether he is wise.
A new statistic called Challenge Run Value, or cRV, exists to measure the wisdom. I designed it to put a run value on every challenge a team makes.[2] The result is a practical answer to the question every dugout faces now: when is a challenge actually worth it?
Success rate is not value
To see why accuracy is the wrong yardstick, think about what a challenge actually does. When a call is overturned, the game state changes. A called strike that becomes a ball moves the count from 0-1 to 1-0, which is worth a few hundredths of a run. A called strike on a 3-2 count with the bases loaded that becomes a walk is a completely different event, one that can swing the expected value of the inning by nearly two runs.
Baseball analysts have long measured these swings with run expectancy, the average number of runs a team can expect to score from a given situation.[3] A runner on second with nobody out is worth a lot more than the same runner with two outs, and the count matters too. The standard run expectancy matrix tracks the 24 base-out states, but the ABS challenge manipulates the count specifically, so cRV uses the richer RE288 surface that conditions on the ball-strike count as well.[4]
Every challenge has two possible futures. The original reality, where the call stands. And the overturned reality, where the call is reversed. The value of a successful challenge is the difference in run expectancy between those two futures, worth more when the situation is more extreme. A failed challenge changes nothing on the field, which is exactly why the old way of scoring challenges was so misleading. It treated every failure as a zero, and every win as whatever the immediate play was worth, with no accounting for what was lost.
The cost of a wasted challenge
The second half of cRV is the opportunity cost, and this is where the scarcity of the resource comes in. A failed challenge is not just a lost call; it is a lost option. The team that burns a challenge in the first inning forfeits the ability to use it in the seventh, the eighth, or the ninth, when a single call can decide a game.
cRV charges that cost explicitly. A failed challenge is penalized in proportion to how much game remains and how much of the challenge budget is left. A failed first-inning challenge forfeits eight innings of option value and is charged a full share of that. A failed ninth-inning challenge forfeits nothing, because there is no game left in which to use it, and is charged nothing. And because a team starts with two challenges, losing the second one hurts more than losing the first, since the second one was the last option you had.
This is the same logic that economists and operations researchers have applied to challenge systems in other sports. In tennis, where players get a limited number of Hawk-Eye challenges, researchers have studied whether players challenge optimally and found systematic patterns in when they do and do not.[5] In cricket, the Decision Review System has the same retained-on-success rule as ABS, and studies have documented how teams use their reviews strategically.[6] Baseball’s new challenge is the same family of problem, and cRV brings the same kind of run-denominated thinking to it.
The insight that changes everything
My paper’s most important methodological finding is about the challenges that end the plate appearance. A called strike on an 0-0 count just moves the count. A called strike on a 3-2 count ends the at-bat. And the challenges that end the at-bat are exactly the ones teams spend most often, because they are the ones where the stakes are highest.
Consider a bases-loaded walk. In the fifth inning with the bases loaded, one out, and a 3-2 count, the umpire calls strike three and the batter challenges. He wins, and the pitch becomes ball four. The runner on third is forced home, the bases stay loaded, and the inning continues. That single overturn is worth roughly 1.91 runs, the difference between a strikeout with two outs and a walk with a run already in, and it is the single most valuable challenge outcome available.
Now consider the reverse. A catcher challenges a called ball on a 3-2 count with the bases loaded and two outs in the fourth inning. He wins, and the pitch becomes strike three. The inning is over, a run that was about to be forced in is erased, and the threat is extinguished. That is worth about 1.72 runs.
The striking thing about these numbers is how easy they are to get wrong. Earlier versions of the metric treated every plate-appearance-ending state as if it were worth zero runs, on the reasoning that a completed at-bat has no count-conditioned run expectancy left. That is a category error. The plate appearance ends, but the inning does not. A bases-loaded walk leaves the bases loaded with a run already in. A strikeout with one out leaves runners on with two outs. Both states carry substantial run expectancy.
The practical consequence is severe. On the full set of challenges from the 2026 season, treating terminal states as zero drives the average challenge value to negative 0.016 runs, meaning the metric would report that challenging is, on net, harmful. With terminal states valued correctly, the average is positive 0.159 runs. The sign of the headline result flips on this one modeling decision, and it flips on real data, not a constructed example.[2:1] Getting the big moments right is not a detail. It is the whole result.
The three case studies
Three events from my paper illustrate the economic content of the metric. Each is traced from the pre-pitch state through to the final score.
The bases-loaded walk conversion by Eli White, worth plus 1.91 runs, is the most valuable single challenge outcome available. A forced run plus the gap between one and two outs with the bases loaded is an enormous swing, and the challenge is retained because it succeeded, so there is no penalty.
The inning-ending strikeout conversion by Luis Campusano, worth plus 1.72 runs, is the case the old zero-everything treatment got most wrong. It scored the inning-ending conversion, which erases a run already in and ends the threat, at zero. Correctly valued, it is one of the most valuable defensive plays a catcher can make.
And the early failed challenge by Carter Jensen, worth about negative 0.07 runs, shows the other side. A first-inning failed challenge, with both challenges still held, is charged a modest penalty. Had it been the team’s last challenge, the charge would have doubled. Had it happened in the ninth, it would have been zero. Same outcome, same accuracy, different price, entirely determined by how much game remained and how much of the budget survived.
Catchers are the story
Applied to the 1,971 plate-appearance-ending challenges recoverable from the 2026 regular season, the metric produces a clear headline. Batters and catchers issue challenges in almost equal numbers, 985 versus 984, but catchers accumulate 227.6 runs of challenge value to the batters’ 86.7, a per-challenge mean of 0.231 against 0.088. Catchers generate roughly two and a half times the value per challenge that batters do.[2:2]
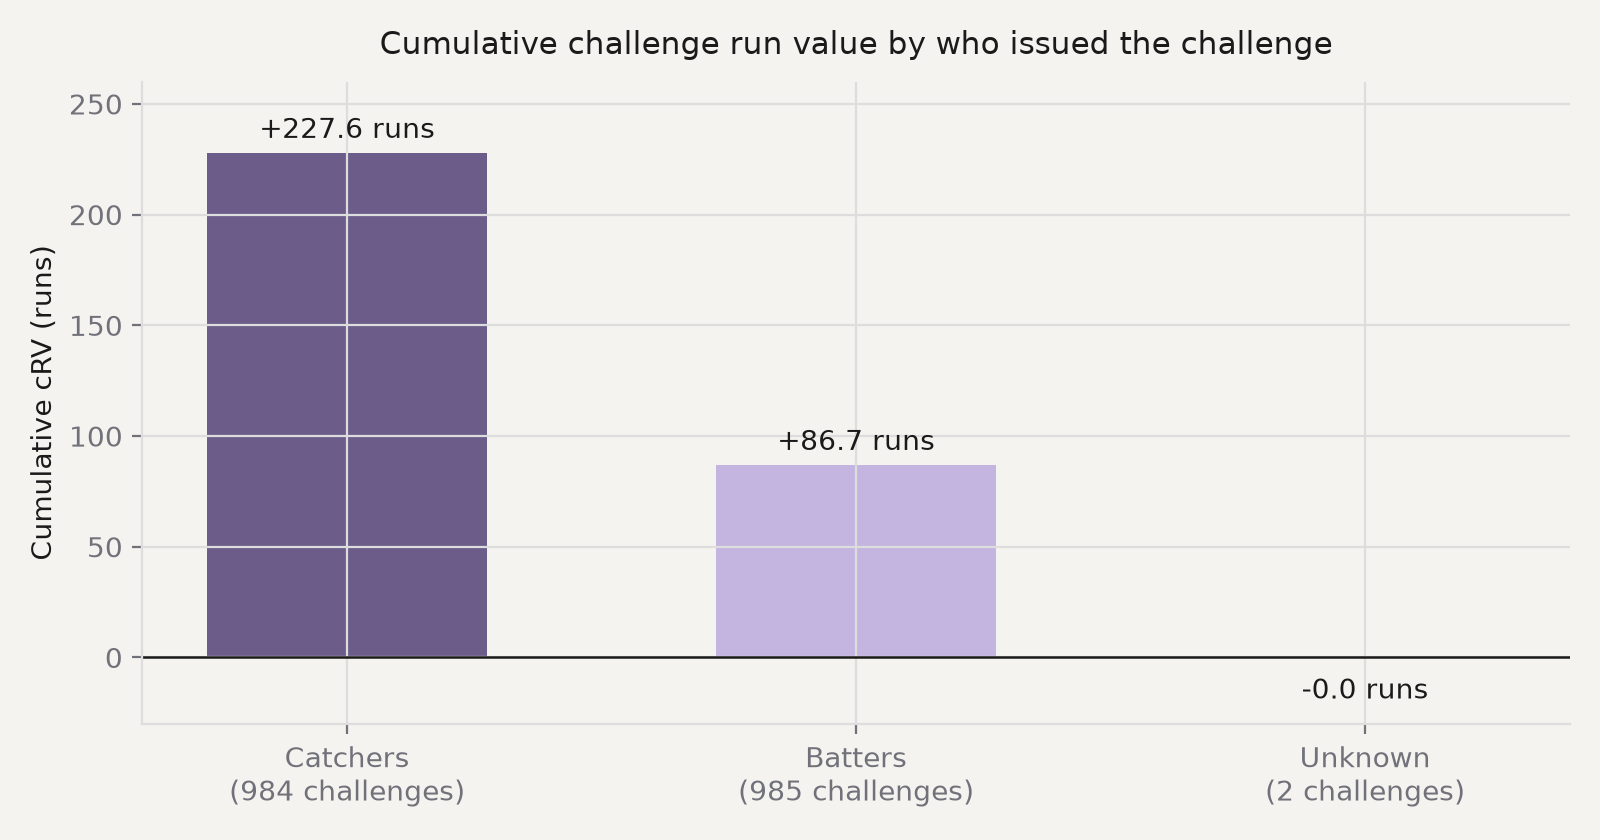
The reason is structural. A catcher’s most valuable challenge is converting a borderline two-strike take into an inning-ending out, turning what would have been a walk into a strikeout and ending the threat. A batter’s typical challenge is converting a called third strike into a mere continuation of the at-bat, a real but far smaller swing. The same accuracy, applied in structurally different spots, produces very different value.
| Role | Challenges | Cumulative cRV | Mean cRV |
|---|---|---|---|
| Catcher | 984 | +227.6 runs | 0.231 |
| Batter | 985 | +86.7 runs | 0.088 |
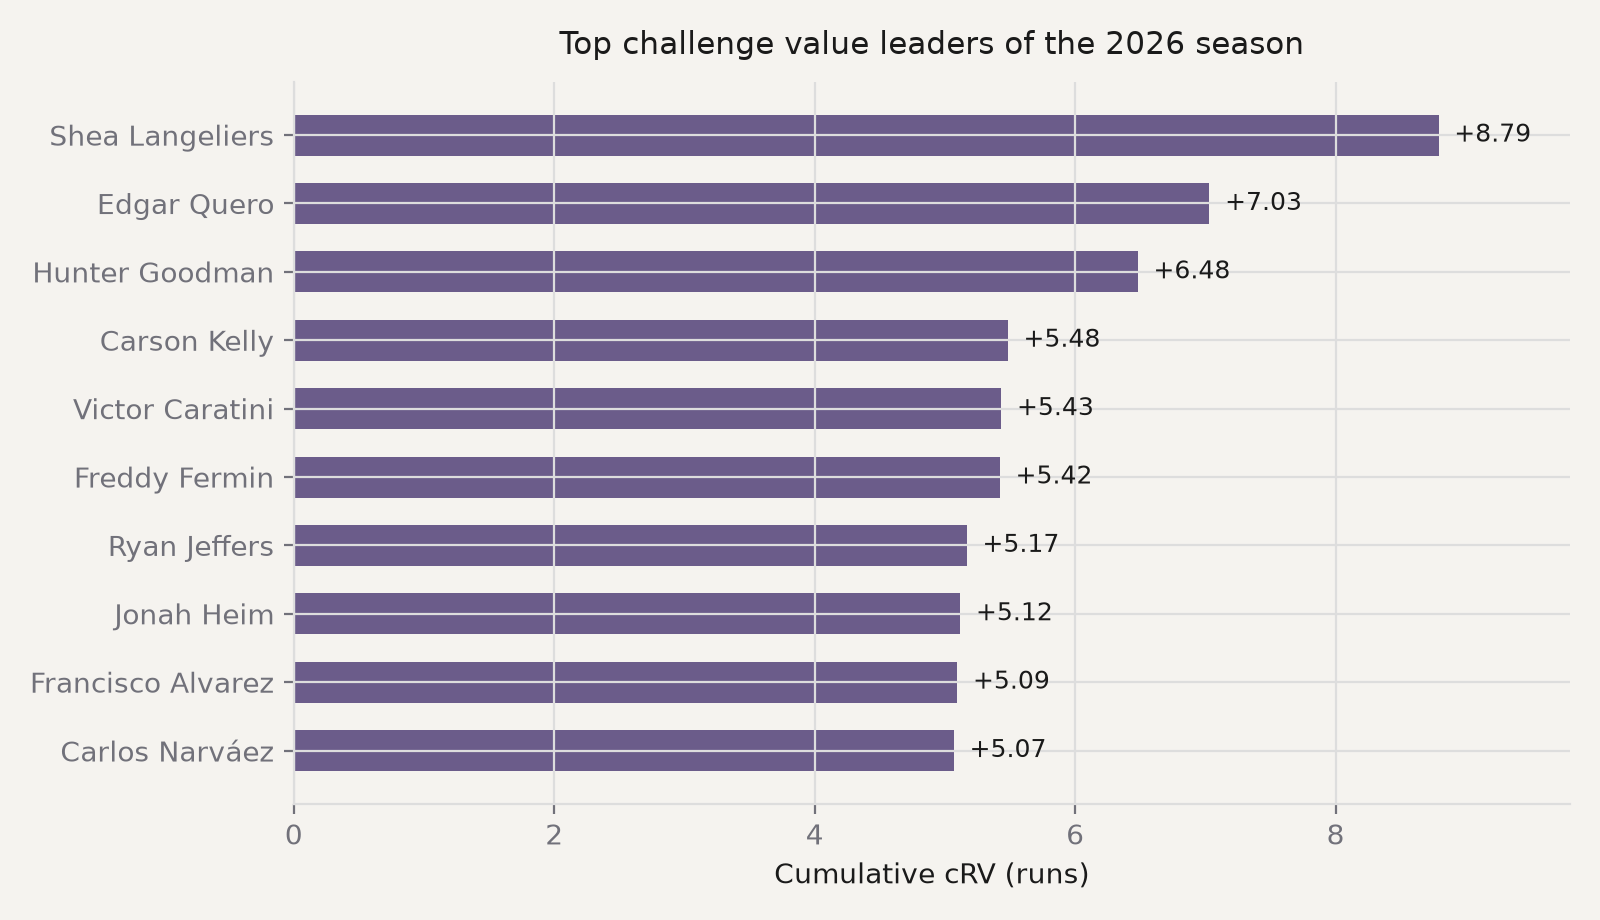
The player-level leaderboard is dominated by catchers for the same reason. Shea Langeliers tops the list with a cumulative cRV of 8.79 runs across 33 challenges, followed by Edgar Quero and Hunter Goodman. The top ten are all catchers, the primary users of the challenge.
| Player | Role | Challenges | Cumulative cRV |
|---|---|---|---|
| Shea Langeliers | catcher | 33 | +8.79 |
| Edgar Quero | catcher | 18 | +7.03 |
| Hunter Goodman | catcher | 26 | +6.48 |
| Carson Kelly | catcher | 17 | +5.48 |
| Victor Caratini | catcher | 24 | +5.43 |
What this means for how teams play
The managerial implications follow directly. Under the cRV framework, challenging a borderline strike on an 0-0 count is rarely justified. The count move is worth a few hundredths of a run, while a first-inning miss costs the team a meaningful share of its challenge budget. The break-even win probability is high, higher than typical challenge success rates, so early-count challenges with the bases empty are almost always a bad trade.
By contrast, full-count challenges that end the plate appearance, especially with runners on and two outs, can swing between half a run and a run and a half of expectancy. At those magnitudes, the break-even probability falls into the low single digits of percent. The clear instruction to players is to spend challenges almost freely on plate-appearance-ending calls with runners in scoring position, and almost never on early-count calls with the bases empty.[2:3]
This is a decision-quality signal that raw accuracy cannot provide. A catcher who goes 5-for-10 on low-leverage challenges may post a worse cRV than one who goes 3-for-5 exclusively in high-leverage spots. Accuracy measures the eye. cRV measures the judgment.
There is also a larger story about how the challenge changes catcher value in the ABS era. For decades, catcher framing, the skill of making borderline pitches look like strikes through receiving technique, was one of the most valuable defensive skills in baseball, worth dozens of runs a season for the best catchers.[7] In a world where borderline pitches can be challenged and reviewed, the value of framing on challenged pitches compresses toward zero, while the value of knowing when to challenge becomes the live skill. The two metrics partition the borderline-pitch value space: framing governs the pitches nobody reviews, and cRV governs the ones somebody does.
Honest about the limits
I was careful about the caveats in the paper. The 1,971 challenges are a season-to-date census of the challenges that end plate appearances, because the public data source only records those, so the results capture the highest-leverage events and omit the low-value count-changing tail. The mean is therefore upward-biased relative to all challenges. The sample is one season, which is too small for player-level cRV to be a stable skill signal yet, with within-season reliability modest. And the opportunity-cost penalty is a deliberate simplification of the full dynamic-program solution that the tennis and cricket literature computes exactly.[5:1]
None of this undercuts the central conclusion. The positive mean cRV holds across the entire range of reasonable assumptions about how much a retained challenge is worth, and the ranking of successful high-leverage events is completely insensitive to that choice. Challenging, as used in 2026, added run value on net. The question now is not whether challenges are worth using, but when.
The takeaway
The ABS challenge turned catcher judgment from a continuous physical skill into a discrete strategic one, and the game is still learning how to play it. cRV gives teams a principled basis for deciding when to spend a scarce challenge, and for separating the high-leverage conversion skill from reckless early usage, a distinction that is invisible to raw success rates. In a sport increasingly run on the margin, the difference between a wise challenge and a wasted one is measured in runs, and now, finally, those runs are counted.
References
Major League Baseball. (2026). Everything you need to know about the new ABS challenge system. MLB.com. https://www.mlb.com/news/abs-challenge-system-mlb-2026 ↩︎
Goldstein, J. (2026). Challenge Run Value (cRV): Quantifying Strategic Value in MLB’s ABS Challenge Era. Preprint, August 13, 2026. https://zenodo.org/records/21925850 ↩︎ ↩︎ ↩︎ ↩︎
FanGraphs. RE24. Sabermetrics Library. https://library.fangraphs.com/misc/re24/ ↩︎
Tango, T. (2018). RE288: Run Expectancy by the 24 Base-Out States x 12 Plate-Count States, Recursively. Tangotiger.net. http://tangotiger.com/index.php/site/article/re288-run-expectancy-by-the-24-base-out-states-x-12-plate-count-states-recursive/ ↩︎
Abramitzky, R., Einav, L., Kolkowitz, S., & Mill, R. (2012). On the Optimality of Line Call Challenges in Professional Tennis. International Economic Review, 53, 939-964. https://doi.org/10.1111/j.1468-2354.2012.00706.x ↩︎ ↩︎
Shivakumar, R. (2018). What Technology Says About Decision-Making: Evidence From Cricket’s Decision Review System. Journal of Sports Economics, 19. https://doi.org/10.1177/1527002516657218 ↩︎
MLB Advanced Media. Statcast Catcher Framing Leaderboard. Baseball Savant. https://baseballsavant.mlb.com/leaderboard/catcher-framing ↩︎