Imagine two hitters who finish the season with identical numbers. Same wOBA, same wRC+, same home run total. On paper they are interchangeable, and the front office spreadsheet treats them that way. Now imagine their seasons in detail. One of them spent the summer squaring up 97 mph fastballs at the top of the zone, hitting lasers off pitches that would embarrass most of the league. The other spent the summer feasting on hanging sliders and middle-middle mistakes, waiting for the one pitch per at-bat that was actually hittable.
Those two players are not the same player. But every public hitting statistic in baseball treats them as if they were.
This is the gap that a new statistic called Pitch-Quality Surplus, or PQS, is built to close. I designed it to ask a question that no mainstream stat currently answers: not just how good a hitter’s results were, but how hard the pitches he faced actually were.[1] The answer turns out to matter a lot for how teams should value hitters, pay them, and develop them.
The blind spot in every hitting stat
Baseball’s modern stat stack is genuinely impressive. Weighted on-base average, or wOBA, takes every outcome of a plate appearance and weights it by its actual run value, so a home run counts more than a single, which counts more than a walk.[2] Expected wOBA, or xwOBA, goes a step further and replaces what actually happened with what should have happened based on the quality of contact, using exit velocity and launch angle to strip out the luck of where a ball happens to land.[3] Weighted runs created plus, or wRC+, adjusts for ballpark and league context and rescales everything so that 100 is exactly league average.[4]
These are real advances. But they all share one blind spot. Every one of them conditions on what the hitter did, and none of them conditions on what the pitcher threw.
A home run in wOBA is worth the same 2.03 runs whether it came off a 99 mph fastball with 20 inches of movement or off an 88 mph hanging slider that a batting practice machine would be embarrassed to throw. xwOBA treats a 110 mph exit velocity off a mistake and a 110 mph exit velocity off an elite heater as identical, because it only looks at the contact, not the pitch that produced it. Even Stuff+ and Location+, the sophisticated pitch-grading metrics popularized by Eno Sarris, describe the pitcher’s arsenal, not how a hitter performs against it.[5] They answer “how good is this pitch,” never “how good is this hitter at handling this pitch.”
The result is a systematic misreading of player value. A hitter who runs an above-average wOBA against a soft diet of pitches looks better than his actual skill against good pitching would justify. A hitter who posts a merely average wOBA while constantly facing elite stuff is quietly underrated. Both get the same grade, and nobody can tell which is which.
The idea: measure the surplus
PQS starts from a simple idea. For every pitch a hitter sees, ask what a league-average hitter would be expected to do against that specific pitch. A 97 mph fastball up and in with two strikes is a hard pitch; the average hitter does poorly against it. A middle-middle 90 mph meatball is an easy pitch; the average hitter does well against it. Then compare what actually happened to what the pitch implied.
The difference is the surplus. It is the run value a hitter produced above what the pitches themselves suggested, and it isolates the hitter’s contribution rather than the difficulty of his schedule. Sum it over a season and you have a counting statistic in runs, or a rate statistic per 100 pitches. Scale it like wRC+ so that 100 is league average and a star lands around 130 to 150, and you get PQS+.[1:1]
The crucial detail is that the expected-value baseline is built only from what happened before the ball was hit. Velocity, movement, spin, release extension, plate location, the count, and the lefty-righty matchup. No exit velocity, no launch angle, no outcome. That matters, because it means the model cannot accidentally absorb the very hitting skill PQS is trying to measure. The pitch’s difficulty is graded before the hitter ever swings, and whatever he does beyond that grade is his surplus.
Two ways to be good
The most interesting thing PQS reveals is not just how much surplus a hitter creates, but how. In the paper I split every pitch a hitter sees into three tiers of difficulty, and then measure surplus separately on the hardest third and the softest third.
Tough-Pitch Surplus, or TPS, is the value a hitter earns against the hardest pitches he faces. This is the ability to beat elite stuff, to stay in there against a 97 mph fastball with late movement and still do damage. Mistake-Punishment Surplus, or MPS, is the value earned against the softest pitches, the ability to punish the mistakes pitchers make and make them pay for every hittable pitch.
The headline finding of my paper is that these are two separate skills. Across four seasons and thousands of batter-seasons, TPS and MPS correlate with each other at just 0.04, which is to say almost not at all.[1:2] Knowing how good a hitter is at beating elite stuff tells you essentially nothing about how good he is at punishing mistakes. A hitter can be elite at one and terrible at the other, and the raw statistics cannot see the difference.
What the profiles look like
The case studies in my paper make the point concrete. Consider four hitters.
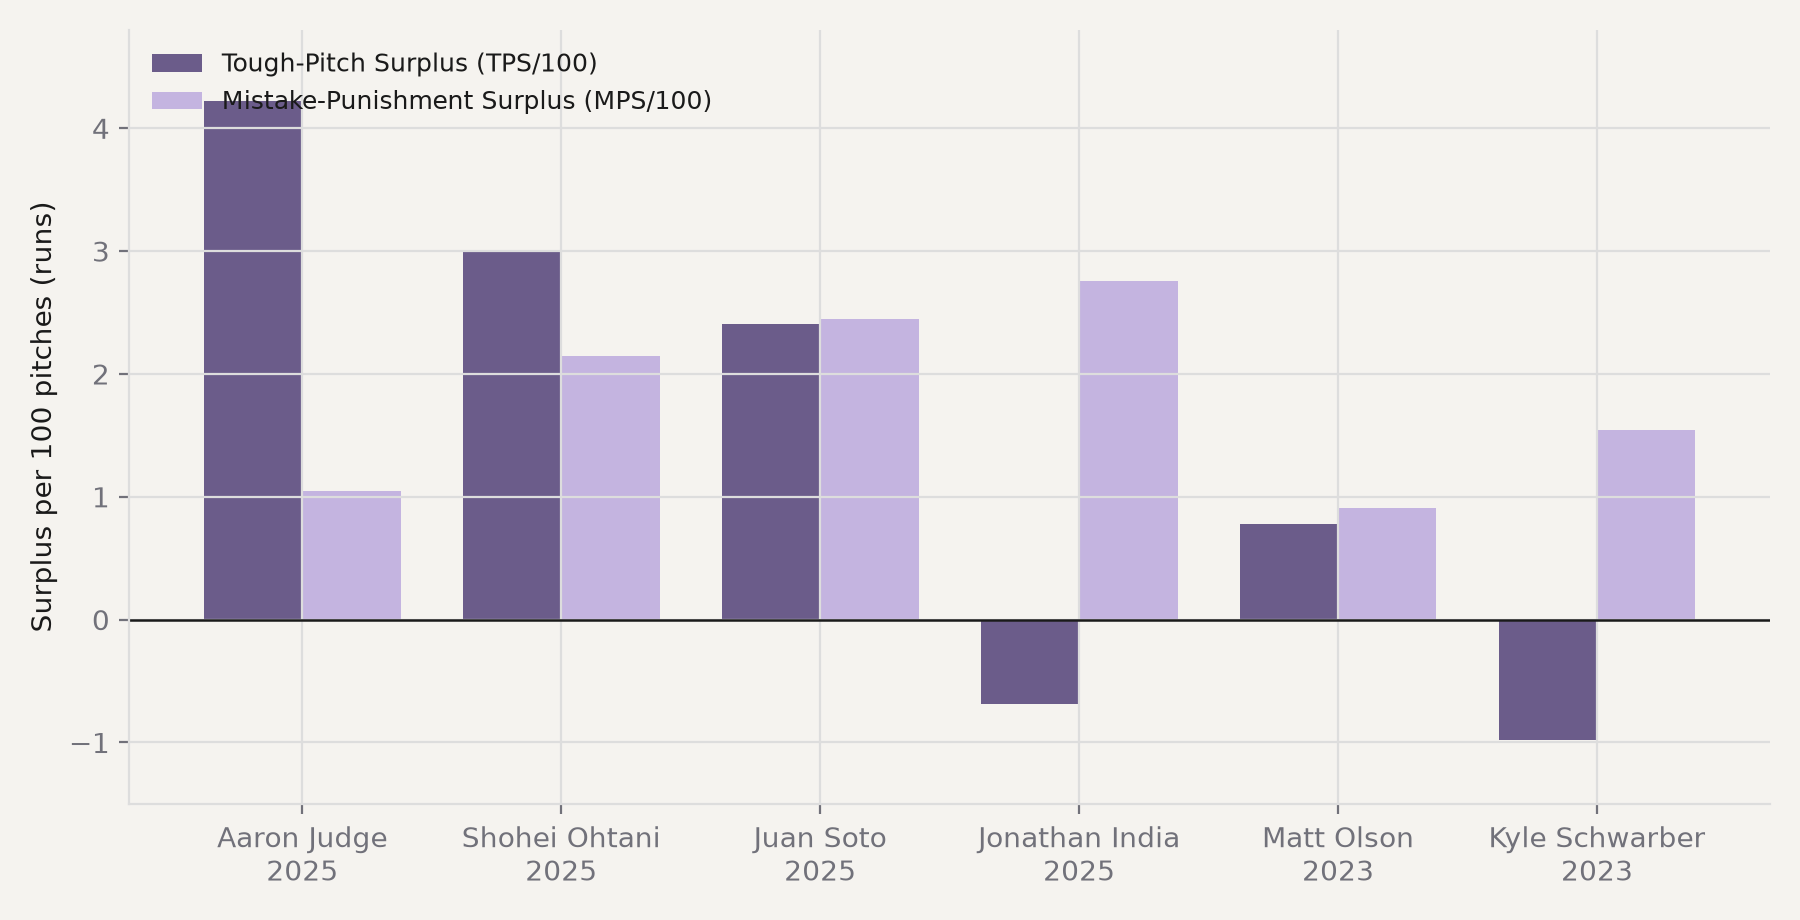
Aaron Judge’s 2025 season was the best in baseball by PQS, with a PQS+ of 195, and his profile explains why. His value came almost entirely from beating the toughest pitches pitchers could throw, with an MLB-leading TPS of 4.22 runs per 100 pitches, against a far more modest MPS of 1.05. Judge does not feast on mistakes; he beats elite stuff, which is a much rarer and more valuable skill. His raw numbers, as absurd as they were, actually understate how hard his pitch diet was.
Jonathan India is the mirror image. His overall PQS/100 of 0.32 looks thoroughly average, and his wOBA of .309 looks ordinary. But the composition is extreme. He actually loses ground against elite pitches, with a TPS of negative 0.69, while posting an elite MPS of 2.76. His entire offensive value is built on punishing hittable pitches, a profile that no raw statistic can show.
Matt Olson’s 2023 season is the cautionary tale. He posted a gaudy wOBA of .417 and a wRC+ of 168, numbers that scream superstar. But his PQS/100 was just 1.42, with modest contributions on both sides. His xwOBA of .379, well below his actual wOBA, is the tell. Olson’s raw numbers were inflated well above his true contact quality, padded by a soft pitch diet and some batted-ball luck. PQS separates the two and flags his season as “empty average,” a hitter whose surface stats overstate his skill against quality pitching.
Juan Soto’s 2025 season is the opposite story. A merely good wOBA of .383 hides an elite PQS/100 of 2.13, earned on both sides of the ledger. His xwOBA of .419 was far above his actual wOBA, confirming that his surface stats understated how much value he created against what he was actually thrown. Soto is the hitter the current stat stack quietly underrates.
| Player | Season | wOBA | xwOBA | PQS/100 | TPS/100 | MPS/100 | Profile |
|---|---|---|---|---|---|---|---|
| Aaron Judge | 2025 | .458 | .448 | 2.93 | 4.22 | 1.05 | Tough-pitch specialist |
| Shohei Ohtani | 2025 | .416 | .423 | 2.13 | 3.00 | 2.15 | Balanced elite |
| Juan Soto | 2025 | .383 | .419 | 2.13 | 2.41 | 2.45 | Underrated |
| Jonathan India | 2025 | .309 | .304 | 0.32 | -0.69 | 2.76 | Mistake punisher |
| Matt Olson | 2023 | .417 | .379 | 1.42 | 0.78 | 0.91 | Empty average |
| Kyle Schwarber | 2023 | .352 | .358 | 0.49 | -0.98 | 1.54 | Mistake punisher |
Two hitters can post similar wOBA and occupy opposite corners of this plane. That is the entire point of the decomposition. A hitter’s surplus profile, not his raw line, is what predicts how he actually earns his value.
The 2025 leaderboard
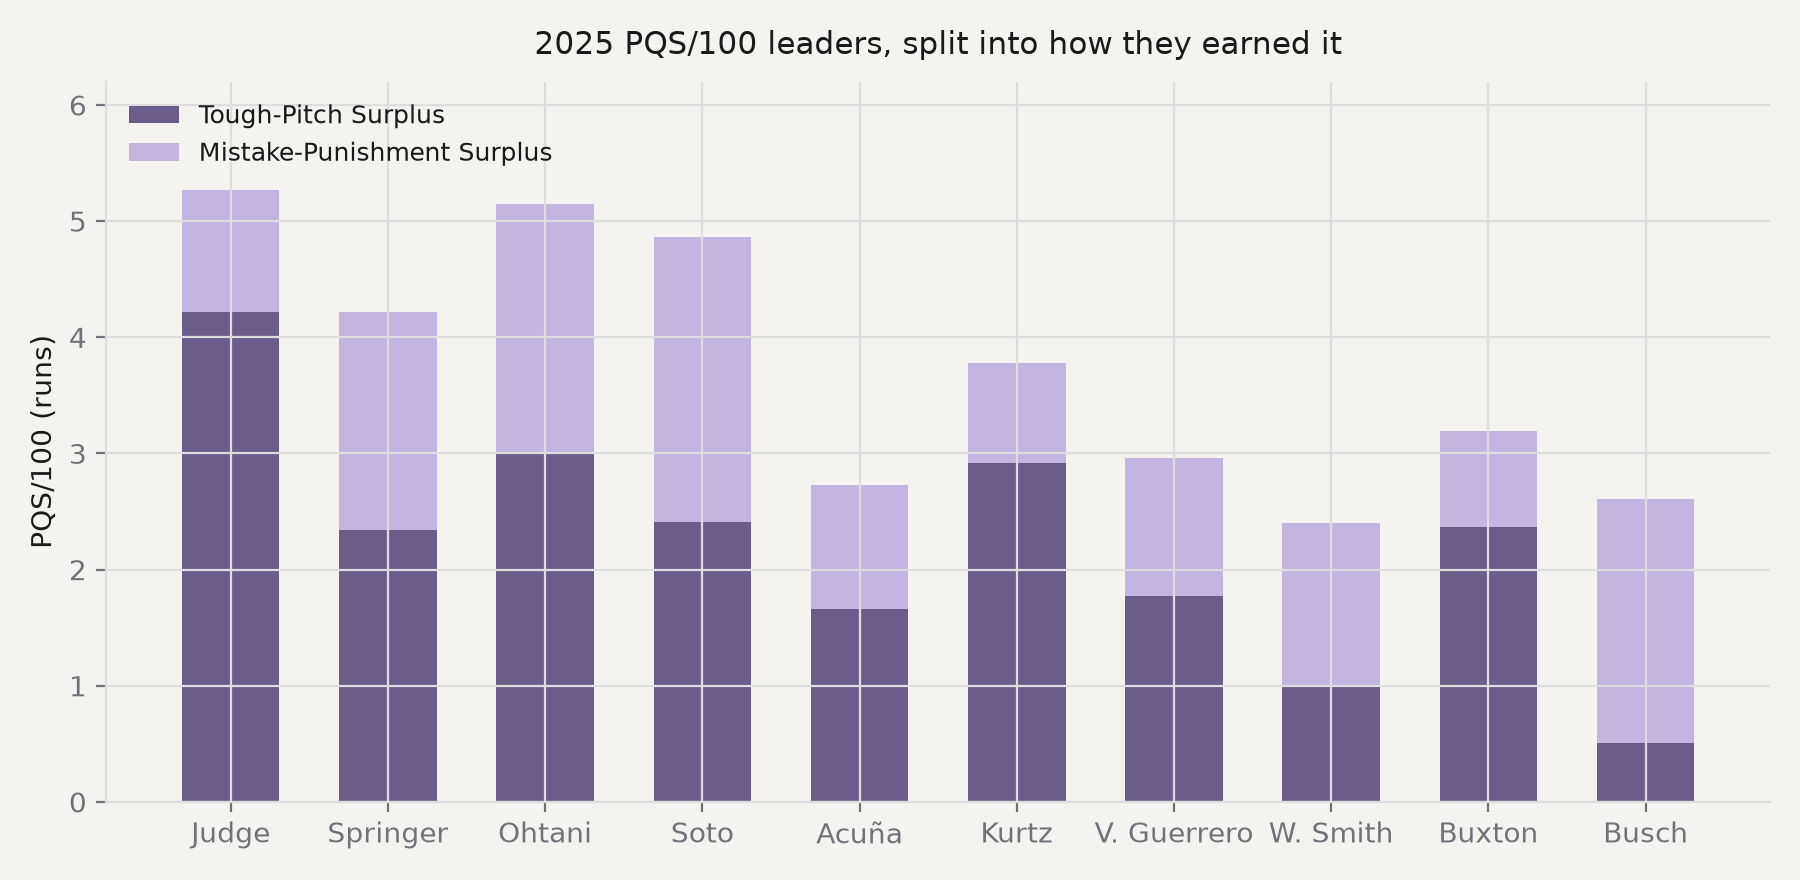
The top of the 2025 leaderboard reads like a who’s who of the game’s best hitters, but the composition tells a fuller story. Judge leads, followed by George Springer, Shohei Ohtani, and Juan Soto, all of whom beat elite stuff and punish mistakes in roughly equal measure. The most instructive names are the ones whose value is one-sided. Cal Raleigh posted a PQS/100 of 1.45 carried almost entirely by TPS of 2.89 against an MPS of essentially zero. He is a low-average slugger who beats tough pitches but does not punish mistakes the way his power would suggest, a profile the split exists to reveal.
| Rank | Player | PQS/100 | TPS/100 | MPS/100 | wOBA |
|---|---|---|---|---|---|
| 1 | Aaron Judge | 2.93 | 4.22 | 1.05 | .458 |
| 2 | George Springer | 2.23 | 2.34 | 1.88 | .398 |
| 3 | Shohei Ohtani | 2.13 | 3.00 | 2.15 | .416 |
| 4 | Juan Soto | 2.13 | 2.41 | 2.45 | .383 |
| 5 | Ronald Acuña | 1.93 | 1.66 | 1.07 | .402 |
| 6 | Nick Kurtz | 1.92 | 2.92 | 0.86 | .419 |
| 7 | Vladimir Guerrero | 1.82 | 1.77 | 1.19 | .379 |
| 8 | Will Smith | 1.74 | 1.01 | 1.39 | .381 |
| 9 | Byron Buxton | 1.74 | 2.37 | 0.82 | .366 |
| 10 | Michael Busch | 1.71 | 0.51 | 2.10 | .371 |
What problems does this actually solve?
The practical payoff is in player evaluation, and there are three distinct places where PQS changes the answer.
The first is free agency and contracts. The Olson case is the nightmare scenario for a front office: a hitter coming off a .417 wOBA and a 168 wRC+ gets paid like a superstar, when his underlying skill against quality pitching is far more ordinary. PQS is a check against paying for empty average. Conversely, the Soto case is the opportunity a smart front office wants to find: a hitter whose surface numbers understate his skill because he faced the toughest pitch diets in the league. These are players you want to acquire before the market figures it out.
The second is player development. If beating elite stuff and punishing mistakes are truly separate skills, then coaching a hitter depends on knowing which one he lacks. A mistake punisher like India does not need to be taught how to hit hittable pitches; he needs to survive better against elite stuff. A one-sided slugger like Raleigh needs the opposite. The current stats cannot tell a hitting coach which problem to work on. The surplus profile can.
The third is the valuation of a season’s true quality. Because PQS strips out the difficulty of the pitch diet, it separates a hitter who is genuinely good from a hitter who merely faced easy pitching. That distinction is invisible to wOBA, xwOBA, and wRC+, and it is exactly the distinction that determines whether a breakout season is real.
Honest about its limits
It is worth being clear about what PQS is not, and I tried to keep the paper honest on this point. PQS is a real but modest adjustment, a second-order refinement rather than a revolution. It is about as repeatable from year to year as wOBA, which is to say less stable than xwOBA, and it adds a significant but small increment of predictive information on top of the existing stats. It does not dramatically improve point forecasts of next year’s wOBA, because most of a hitter’s value is still captured by the stats we already have.
The pitch-quality confound is real, and PQS makes it visible, but it is not the whole story of hitter evaluation. It is the difference between knowing a hitter is good and knowing how he is good, and for teams that make decisions on the margin, that difference is worth a lot.
The takeaway
The next time you see two hitters with identical wOBAs, remember that the box score is lying to you in a subtle way. One of them may be beating the best pitching in the world. The other may be waiting for mistakes. PQS is the tool that finally tells them apart, and in a sport where the difference between a star and a mirage can be worth tens of millions of dollars, that is not a trivial distinction. It is the whole game.
References
Goldstein, J. (2026). Pitch-Quality Surplus (PQS): Measuring Hitter Value Net of Pitch Quality. Preprint, August 14, 2026. https://zenodo.org/records/21972365 ↩︎ ↩︎ ↩︎
FanGraphs. wOBA. Sabermetrics Library. https://library.fangraphs.com/offense/woba/ ↩︎
MLB.com. Expected Weighted On-base Average (xwOBA). Statcast Glossary. https://www.mlb.com/glossary/statcast/expected-woba ↩︎
FanGraphs. wRC and wRC+. Sabermetrics Library. https://library.fangraphs.com/offense/wrc/ ↩︎
Sarris, E. Stuff+: A Comprehensive Pitch-Quality Metric. The Athletic. https://www.nytimes.com/athletic/6048449/2025/02/05/mlb-statistic-stuff-plus-changing-game/ ↩︎